This article was produced as part of The Rhode Island College & University Research Collaborative, an innovative project to bring academic research and expertise to state policymakers.
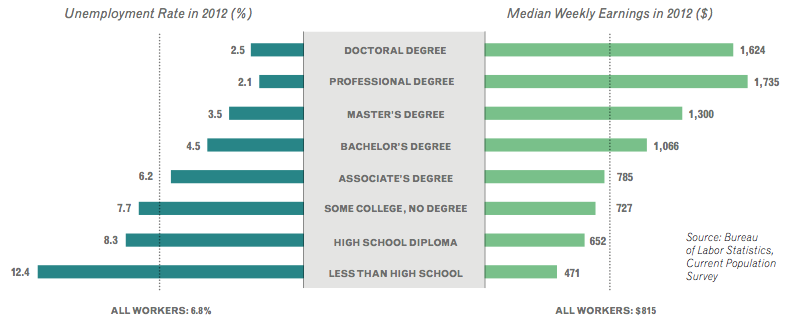
The strength of any economy depends in large part on the strength of its labor force, particularly the presence of skilled labor. Workers with high levels of education and specialized skills and expertise are an essential part of a healthy economy.
The development of this kind of human capital drives economic growththrough increased productivity, innovation, investment, wages, and job growth.1 Higher levels of education, training, and expertise lead to greater productivity, which means skilled workers can contribute more economic value per hour worked than unskilled workers.2 Skilled workers also earn more than unskilled workers and are more likely to be employed, therefore contributing more in taxes.1
Educational opportunities, tax policies, and a variety of other factors all play a role in a state’s ability to develop, attract, and retain skilled workers. Our research evaluates our home state of Rhode Island’s ability to compete with other states in the region by cultivating a skilled labor force. Using data from the U.S. Department of Labor’s Current Population Survey, we examine the characteristics of the state’s labor force and tax policies in comparison to those of its neighbors, Massachusetts and Connecticut.3 The data are from the years 2006 to 2012, thus covering the period before, during, and after the most recent recession.

A Look at Rhode Island’s Population and Labor Force
In recent years, Rhode Island has been experiencing both a flow of residents moving away and a high unemployment rate for those who remain.(a) Between 1991 and 2009, a net total of 10% of Rhode Island’s population – over 100,000 residents – left the state, primarily headed south to places like Florida and North Carolina.4 Migration away from the state resulted in a loss of $1 billion in Rhode Island’s personal income tax base between 2000 and 2010.4
In the years during and after the recession, Rhode Island suffered from one of the highest unemployment rates in the country, peaking at 11.9% in early 2010. As of March 2014, the state’s unemployment rate of 8.7% was the highest in the U.S., well above the national average of 6.7% and the rates in both Massachusetts (6.8%) and Connecticut (7.2%). The per capita GDP of Rhode Island ($48,515) also significantly lags behind that of Connecticut ($63,845) and Massachusetts ($60,768).
One factor that can play a role in unemployment and earnings is the skill level of a state’s labor force, since less-skilled workers face worse employment prospects. Rhode Island’s workforce is less educated and lower paid than the workforces of its immediate neighbors. The high school and college completion rates of Rhode Island residents are comparable to those in the rest of the United States, but lower than the rates in Connecticut and Massachusetts.(b)
As might be expected given the lower educational level of its workforce, Rhode Island has more workers in lower-paying occupations and fewer workers in higher-paying occupations than Massachusetts and Connecticut. Compared to its neighbors, Rhode Island has a higher portion of its workforce (59%) engaged in occupations with median earnings of less than $40,000 a year; the figure for Connecticut is 56% and for Massachusetts is 53%. The state also has a smaller share of its labor force in high-income occupations such as Management, Business & Finance, Architecture & Engineering, and Computer & Mathematical occupations. In addition, workers in the same occupations generally make less money in Rhode Island than in the other two states.3
The Role of Taxes in Attracting Skilled Workers
In addition to educational and employment opportunities, taxes are also a factor that may influence where people choose to live. How does Rhode Island stack up when it comes to taxes, and might that be playing a role in the fact that it has fewer skilled workers and more low-paying jobs than its neighbors?
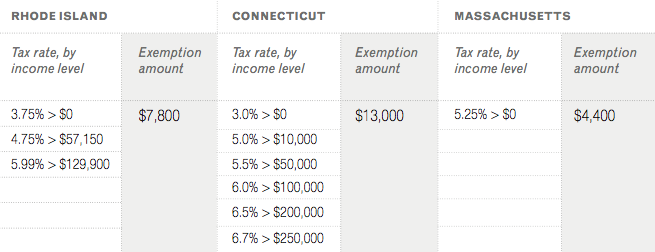
At most income levels, individuals face lower tax rates in Rhode Island than in neighboring states (the exceptions are people earning below $10,000 in Connecticut and above $129,900 in Massachusetts).(c) This was not true prior to 2011, when Rhode Island imposed much higher rates on middle- and high-income earners.

In our analysis, we calculated the tax that would be owed on the median salary for each occupational group.5 We found that the estimated tax owed for many occupational groups is lower in Rhode Island than in Massachusetts or Connecticut. This difference results in part from the state’s lower tax rates. However, it is also driven by the fact that workers in the same kinds of occupations often earn less in Rhode Island. The state receives less tax revenue from its residents in part because their wages are lower than workers in comparable occupations in neighboring states.
While lower taxes might theoretically draw people to Rhode Island, rather than Massachusetts or Connecticut, the academic literature does not offer a clear consensus on whether tax rates actually affect where people choose to live. Some studies find that tax rates influence migration from state to state within the U.S.6 If this is the case, lower tax rates, particularly for higher-income brackets, might attract more skilled workers. However, other research indicates that taxes are not a significant factor affecting where people choose to live, and that issues such as employment opportunities and quality of life are much more relevant.7
Regional Competitiveness and Rhode Island’s Economic Future
When it comes to regional competitiveness, Rhode Island lags behind its neighbors in some key ways. The education level of residents – a key measure of a skilled labor force – is lower than that of residents in Massachusetts and Connecticut. Perhaps because of this educational difference, Rhode Island has a greater share of its workforce in lower-paying occupations. Workers also earn less than their counterparts in similar occupational fields in Massachusetts and Connecticut.
Because of these lower wages – and because the state’s tax rates are lower for low- and middle-income brackets – many Rhode Island workers end up paying less in taxes than they might if they were working in a similar occupation in a neighboring state, in which case they might both earn more and pay more in taxes.(d)
Overall, the role tax policy plays in Rhode Island’s ability to attract and retain a skilled labor force is difficult to ascertain. The academic literature is mixed on the question of whether tax rates influence where people choose to live. Research suggests that factors like employment opportunities and quality of life are more salient, and the data show that wages are lower and unemployment is higher in Rhode Island than in neighboring states. Ultimately, when it comes to regional competitiveness, focusing on raising wages and increasing employment opportunities might be more relevant for attracting a skilled labor force than making changes to tax policy.
Endnotes
- International Labour Office (2011) A Skilled Workforce for Strong, Sustainable, and Balanced Growth: A G20 Training Strategy, Geneva, Switzerland: International Labour Organization. Gary S. Becker (2008) Human Capital, The Concise Encyclopedia of Economics, Library of Economics and Liberty.
- Jerome A. Mark (1986) “Problems encountered in measuring single- and multifactor productivity,” Monthly Labor Review, December 3.
- The Current Population Survey collects information on 820 detailed occupations clustered in 22 major groups. For RI, CT, and MA, we analyzed the occupational distribution of the labor force, the median earnings of each major occupational group, and the personal income tax that would be paid on these earnings. We supplemented our primary analysis with data on educational levels from the U.S. Census Bureau and data on state-to-state population migration and tax rates from The Tax Foundation.
- J. Scott Moody and William J. Felkner (2011) “Leaving Rhode Island”: Policy Lessons from Rhode Island’s Exodus of People and Money, Providence, R.I.: Ocean State Policy Research Institute. Richard Borean (2013) “Monday Map: Migration of Personal Income,” Tax Policy Blog, The Tax Foundation, August 19.
- For each of the three states, we calculated the personal income tax (in dollars) that would be paid on the median earnings of each of the 820 detailed occupational groups. Tax rates were drawn from The Tax Foundation and our calculations were based on the assumption of a single person with no dependents and the standard deduction. Because drawing comparisons across several hundred occupations is challenging, we aggregated the tax figures by major occupational group, taking the mean of the tax figures from each detailed occupational group.
- Raven Molloy, Christopher L. Smith, and Abigail Wozniak (2011) “Internal Migration in the United States,” Journal of Economic Perspectives, 25(3): 173-196. Mark Gius (2011) “The effect of income taxes on interstate migration: An analysis by age and race,” The Annals of Regional Science, 46(1): 205-218.
- Jeffrey Thompson (2011) “The Impact of Taxes on Migration in New England,” Political Economy Research Institute, University of Massachusetts, Amherst. Cristobal Young and Charles Varner (2011) “Millionaire Migration and State Taxation of Top Incomes: Evidence from a Natural Experiment,” National Tax Journal, 64(2): 255-284.
Sidenotes
- (a) Like Rhode Island and other states in the Northeast, Massachusetts and Connecticut have also been losing residents. The movement back and forth between Rhode Island and its immediate neighbors, however, has been relatively balanced.
- (b) In 2009, the same share of Rhode Island and U.S. residents (85%) had at least a high school diploma, while 89% of both Connecticut and Massachusetts residents had a diploma. 42% of Rhode Islanders had a college degree, greater than the 38% national average but lower than in Connecticut (51%) and Massachusetts (55%).
- (c) Massachusetts is one of nine states with a flat tax structure, in which people at all income levels pay the same tax rate. Rhode Island, like most other states, has a progressive tax structure where rates are higher for those with higher incomes.
- (d) It is important to keep in mind, however, that high-income earners (those earning above $129,900), who are often the most skilled part of the labor force, face lower tax rates in Massachusetts than in Rhode Island.


